Setting Site Specific Energy Reduction Targets
05 January 2018Setting Site Specific Energy Reduction Targets
05 January 2018Every year in September we embark on setting company objectives for the following year. As part of this, our Facilities (FM) and Property (PM) Managers show an increased interest in the energy performance of their properties and what will be expected of them in the coming year. There are many ways to set objectives for a new year, in this blog I will give an overview of how CLS Holdings plc set about providing different options to our FM/PM teams for setting onsite specific energy targets.
Setting Targets
The first stage of our process was to agree the corporate energy target across all our managed assets in UK, France and Germany. For 2018 we have set a target to reduce our like-for-like managed operational carbon emissions by 5% compared to 2017. This is an important first step as it allows us to create our annual energy budget as outlined below.
Our Energy Budget
Having set a 5% carbon emissions target at corporate level, we needed to correlate this to our individual buildings. For simplicity, and to avoid the confusion of carbon conversation factors, we decided to covert the 5% carbon target into a direct 5% energy target. Looking at our UK portfolio and based on the previous 12 months electricity and gas consumption, we calculated that we would need to reduce consumption by 900,000kWh across our like-for-like managed portfolio to achieve the 5% energy reduction. This made it easy for our property team to understand how their target relates to the corporate level target. Decarbonisation factors was excluded from this exercise.
Individual Property Targets
Next, each property was given an individual target rather than a blanket 5% reduction for all properties. The problem with a blanket 5% target is that not all properties perform equally, and it fails to reward and recognise historic reductions. This can frustrate FM/PM teams that have demonstrated their ability to drive efficiencies in previous years through good management and upgrade works. Overall, this year there was a perception among the property management team that there is little more they can do to make their properties run more efficiently.
For example, this is the case for some properties which have, been refurbished or have managed to reduce their energy use significantly in the past. Therefore, we had to ask ourselves if we could design a method which will result in the portfolio hitting a 5% reduction, whilst apportioning a larger share of the targets to those properties we believe to have the greater potential to reduce.
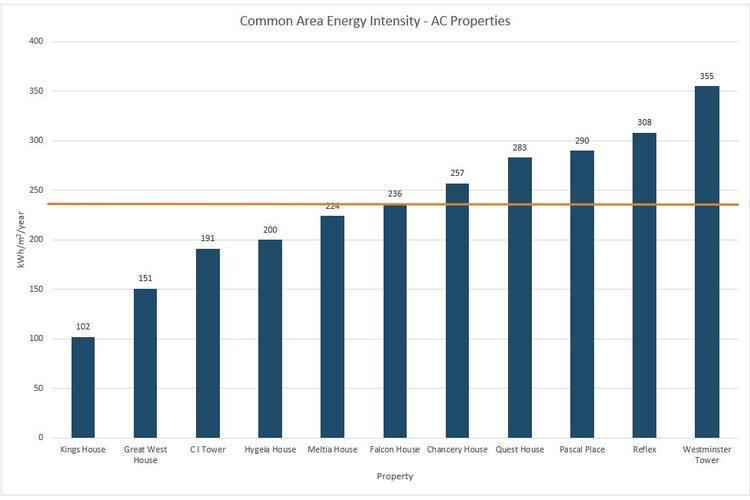
All of our managed UK properties were ranked based on their common energy use per net lettable area (kWh/m2 NLA) over the previous 12 months. Properties were split in to airconditioned and non-airconditioned properties and then ranked most efficient to least efficient. This ranking was used to allocate targets which are more severe for the least efficient properties.
Two differing methodologies to allocate property level targets were assessed. Each have their pros and cons. The common factor used across the two was the energy budget; the need to save 900,000kWh (5%) compared to the previous 12 months.
Method 1 – Incremental increase in reduction targets.
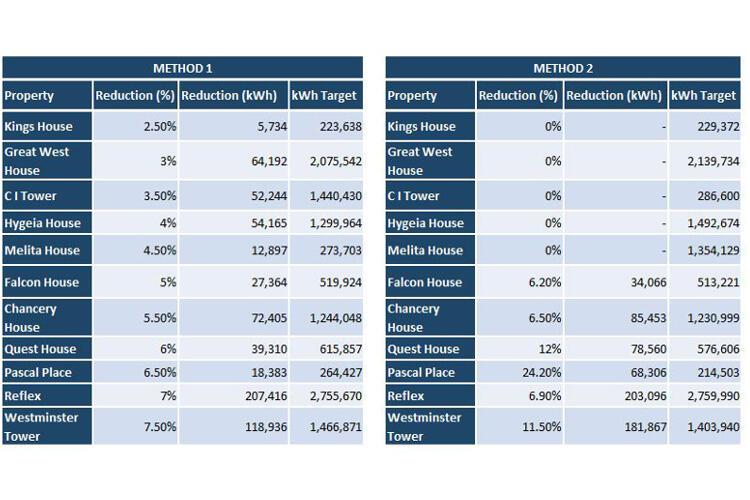
Method 1 used the ranking to allocate a percentage saving, starting at 2.5% for the most energy efficient and then increasing the target by 0.5% incrementally as we moved down the property list. The least efficient property in the AC portfolio was given a 7.5% reduction target. This was repeated for the non-ac properties.
The benefit of this approach was that every property is given a target and none of those targets appears to be too severe or unobtainable. In our opinion the properties with the bigger targets actually benefit the most from this as they should be able to find the required savings targets (4-7%) through better management and small capital works. The most efficient properties will actually find it harder to hit the 2-4% targets without major upgrades to plant or fabric improvements.
Method 2 – Using a benchmark
Method 2 used a benchmark of our portfolio average which was 249kWh/m2/yr for AC offices. Any property that had a common energy intensity below this average was given a ‘free-pass’ and a 0% reduction target for 2018. In reality these are already the most efficient properties, so this would require them to remain an efficiently managed building. An alternative benchmark that we could have used is the BBP’s own Real Estate Environmental Benchmark which happens to be 258 kWh elec. equ. / m2 / year (Typical Practice) for AC offices.
The remaining properties were then given the responsibility to make the required portfolio saving of 900,000kWh between them. The level of saving asked of the properties was calculated using a blend of the property’s distance from the average line and its total energy use. It would be unrealistic to ask a small property to save anywhere near as much as a large property. Once the allocation of kWh savings required of the properties was decided, this amount was converted into a percentage of the properties consumption.
This method resulted in some very large reduction targets, as shown below, which is a major negative of using this method. However, it does not suffer from the previous issue of asking very efficient properties to make further savings which is also unrealistic.
Consulting with the Team
The results were presented to the property team who held a discussion on the preferred method of choice. There was pretty much a 50/50 split between Method 1 & 2. Some of the property team preferred the idea of all properties being given a target and feeling that the whole portfolio was playing a part in hitting the corporate target. They also felt it offered more flexibility in that if one property did not hit its target, there were more properties which could make up the shortfall.
Others preferred method 2 as they liked the idea of focusing on the least efficient properties with bigger opportunities rather than spreading the focus of energy management across the total portfolio and struggling to find savings at already efficient properties.
Outcome
Personally, I liked methodology 2 for the reason given above; it would allow me to focus my time and resource on a select few properties which have bigger savings opportunities. Furthermore, I felt that all of the properties which were included in Method 2 had realistic targets save for one which had a 24% target. However, the UK property team preferred the idea of all being in it together and staying away from targets in double figures. For this reason, we will be proceeding with Method 1 to allocate our property level targets.
I’d welcome feedback from others in the industry that have gone through a similar process. Do you have any suggestions for improving these methodologies? Have you seen any glaring mistakes, or have you tried your own methodology to set individual savings targets for properties in a portfolio?
Find Out More
Rowan Packer
Rowan Packer, Group Sustainability Manager
CLS Holdings plc
T: 020 7840 7779
E: rpacker@clsholdings.com
Brendan Rouse
Sustainability Manager, Landsec